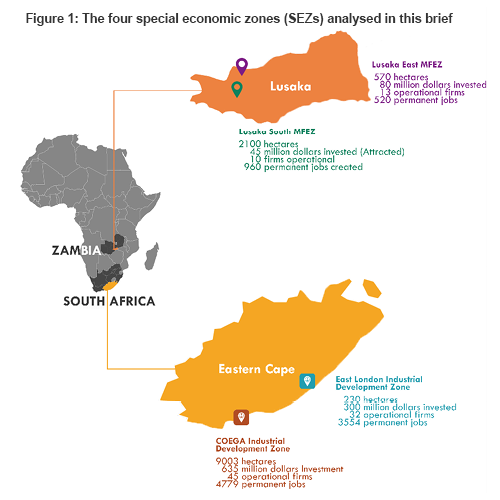
Blueprint, experiences and outcomes
East Asia’s successful experience in accelerating the process of industrial development with SEZs paved way for the use of SEZs as policy instruments in Africa. In southern Africa, Zambia and South Africa instituted SEZs in legal and institutional frameworks in the 2000s as mechanisms for catalysing industrialization and employment creation through foreign and domestic investments.
Are SEZs white elephants, or justified investments?
The notion of a SEZ refers to a geographically designated area where business rules and regulations are more liberal than in the rest of the country, to attract investment and spur economic growth.
Despite the clear evidence on the poor performance of SEZs in Africa, their development has continued to expand in both South Africa and Zambia. This begs the following question: are SEZs just white elephants, or justified investments whose potential can still be unlocked?
Comparing four case studies helps to analyse the extent to which SEZs in Zambia and South Africa have contributed to growth, employment, and yielded positive agglomeration effects.
Many similarities and differences emerge in the experience of these two countries with SEZs. In South Africa the development of SEZs has taken on a more structured and inclusive approach supported by clear deliberate policy frameworks and financing provisions. Zambia, on the other hand, is largely missing a predictable and transparent financing mechanism to secure resources for the successful implementation of SEZs.

The SEZs in both countries are of varying hectare size and designed for various common uses encompassing industrial, commercial, residential, recreation and R&D activities. Typically, zones in South Africa are anchored on key industries such as automotive, mining, oil and gas, precious metals, renewable energy, and light and medium manufacturing. This approach helps to attract suppliers of components and other goods and services. In contrast, those in Zambia are not anchored on strategic industries thus limiting agglomeration economies.
The development and management approaches in the two countries are similar and yet differentiated. Both countries allow for government- and private sector-developed and operated SEZs. However, South Africa restricts private ownership thereby limiting firms’ use of zone assets as collateral for financing. Zambia has taken a minimalist financing approach for the one public SEZ where serviced land is leased out to investors. Conversely, public-developed zones in South Africa lease fully developed buildings constructed using funds from a separate SEZ fund. Both countries engage in own revenue-generating activities, but the SEZ developers in South Africa are a step ahead in diversifying their income streams.
Adequate infrastructure and fiscal incentives are essential
On paper, the zones in both countries boast of offering a range of world-class infrastructure. But with unreliable electricity supply, lack of a quick turnaround time in providing utility services, lack of a one-stop shop to streamline business processes, lack of a connection to sewer lines or support services such as an ambulance, fire brigade, waste collection or market research, SEZs in Zambia fall short of being world-class. South Africa has succeeded better in the provision of infrastructure and business support services.
Financial incentives are present in both countries. However, in Zambia what is now pertaining for firms in SEZs — 0% import duty and accelerated depreciation on capital equipment and machinery — is also on offer to non-SEZ-based firms. In contrast, South Africa is offering a suite of fiscal incentives — namely VAT and customs relief, employment tax incentives, accelerated depreciation allowance on capital structures and reduced corporate tax rate to qualifying SEZ-based companies.
Comparing performance and challenges
At face value, the outcomes of the SEZs seem more promising in South Africa on account of the level of investment and the number of jobs created (see Table 1 below). However, a closer per firm analysis shows that with the exception of employment, the countries are almost at par in terms of their performance. On average, the level of investment by each investor was highest in the Lusaka South Multi-Facility Economic Zone. Employment per firm is highest in the two South African SEZs. Lusaka East Multi-Facility Economic Zone emerges as the most efficient zone in creating jobs.
You can find the full brief here.
Source: UNU - WIDER


