


The WTO and the Organisation for Economic Co-operation and Development (OECD) on 13 January jointly launched a new dataset covering bilateral services trade of over 200 economies from 2005 to 2019. The WTO-OECD Balanced Trade in Services (BaTIS) dataset, which provides detailed data for 12 services sectors in addition to total commercial services, offers a complete and balanced matrix that reconciles previously asymmetrical export and import data.
INTERNATIONAL TRADE STATISTICS
At present, bilateral data are available for less than 70% of world trade in services. For individual services sectors, data coverage can be much lower. Moreover, the availability of statistics on bilateral trade in services varies significantly across countries and regions. More than 90% of Europe's services trade can be captured on a bilateral basis. However, this share drops to only 36% for Asia. No bilateral services transactions are currently reported by African or Middle Eastern economies.
The BaTIS experimental dataset, which uses both official statistics and estimates for missing data, provides users with a complete and balanced matrix covering virtually all economies in the world. It covers the following sectors in the 2010 Extended Balance of Payments Services Classification (EBOPS): manufacturing services on physical inputs owned by others; maintenance and repair services n.i.e.; transport; travel; construction; insurance and pension services; financial services; charges for the use of intellectual property n.i.e.; telecommunications, computer and information services; other business services; personal, cultural and recreational services; and government goods and services n.i.e, as well as total commercial services. It is thus a valuable tool for economic analysis, policy-making and trade negotiations.
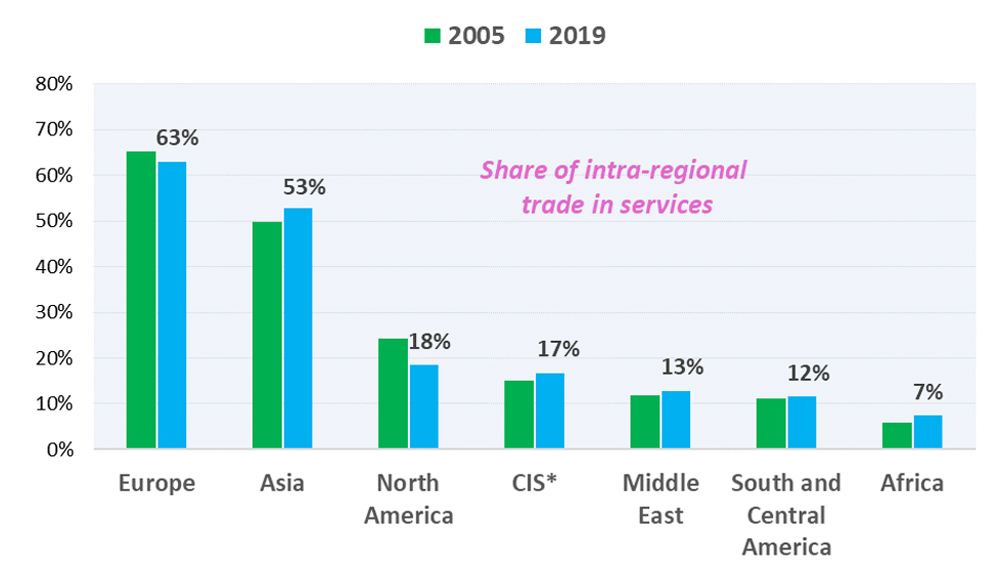
BaTIS data, show, for example, that the share of intra-regional trade in services is very low in Africa (only 7%) even if it comprises more than 50 economies. Intra-regional services flows are also modest in South and Central America and the Caribbean, another large region. The share, in contrast, is highest in Europe and Asia (see chart).
BaTIS estimates also reveal that, in 2019, 12.0% of commercial services exports of least-developed countries (LDCs) were delivered to the United States, followed by China (9.8%) and India (6.0%), largely relating to international travellers' expenditure and transport. Overall, Europe and Asia were the main regional destinations of LDCs' services exports (see chart).
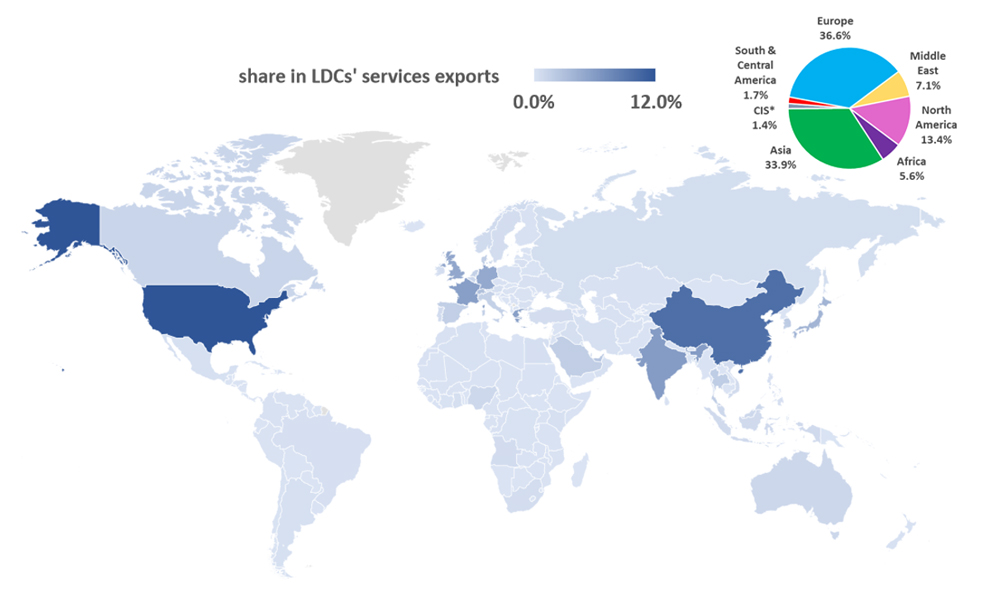
* Commonwealth of Independent States, including certain associate and former member states.
DISCLAIMER: The colours, boundaries and names shown and the designations used on this map do not imply any judgment, official endorsement or acceptance by the World Trade Organization as to the legal status or frontier of any territory. This map intends to make information on WTO members more accessible by organizing such information visually. The map does not intend to show WTO members' non-metropolitan/overseas territories or the status of such territories in regard to the WTO Agreement.
Source: World Trade Organization